
The latest Chainlink price analysis suggests a bearish trend for today and supports sellers as the price has undergone a considerable decrease since morning. Although the bulls were in the winning position and pushed the price of LINK above $6.66, the bears have since taken control and pushed the price to a low of $6.62.
The bulls are trying hard to reclaim the lost ground but there is strong resistance present at $6.87 which is preventing them from making considerable gains. As it stands now, Chainlink prices may face further drops and could even break below the support level at $6.62 unless buyers step in soon and push the price up.
In other news, Chainlink is currently ranked as the 21st largest cryptocurrency by market cap with a market cap of $3.38 billion. It is currently trading at a price of $6.66 with a 24-hour trading volume of $354 billion. The LINK/USD pair has lost over 0.17% in the past 24 hours.
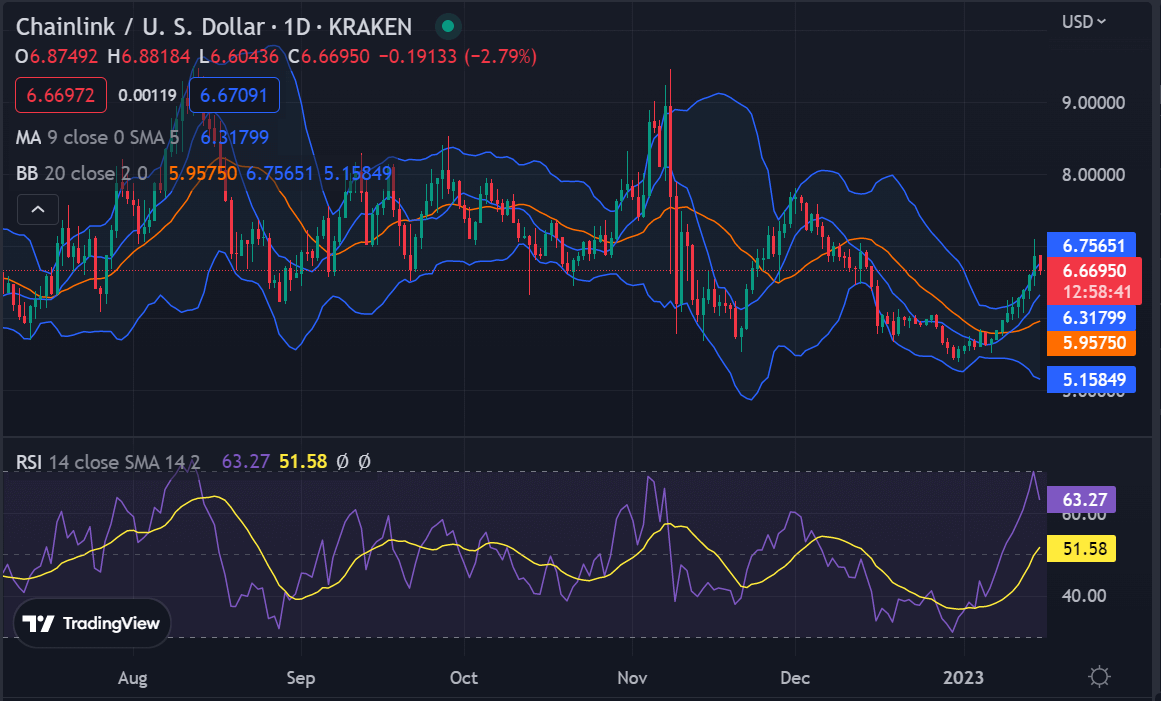
Chainlink price analysis 1-day price chart: Bears in control as prices dip
In today’s trading section for Chainlink price analysis bulls and bears are battling and a clear winner may not be declared soon. However, if the bulls manage to push past the resistance level at $6.87, then LINK could make considerable gains in the coming days and possibly break above the $7 mark.

The RSI indicator is currently at 51.58, and it indicates that the market is in a bearish territory as the RSI indicator is below the 50-level. The moving average value in the 1-day chart is currently at the $6.31 level. The Bollinger bands indicators also hold vital importance in informing us about the current market trends. Its upper band shows the value at $6.75 and its lower band suggests that the price could reach a new low of $5.15 if it continues to be pushed down by the bears.
Chainlink 4-hour price analysis: Latest developments
The 4-hour Chainlink price analysis confirms the downtrend, as the price has been trading below $6.87 for the last few hours. The price has formed lower highs and lower lows, which is a sign of bearish momentum in the market. The bulls have not been able to take the price above $6.87, which is a sign of weakness.

The Bollinger bands values in the 4-hour price chart are as follows; the upper Bollinger band is at $7.02, whereas the lower Bollinger band is at $6.08, respectively. The relative strength index is currently at 66.59, and it does not show any extremities, which suggests that there are no oversold or overbought conditions in the market. The moving average value in the 4-hour chart is currently at the $6.79 level, just below the current price.
Chainlink price analysis conclusion
Chainlink price analysis suggests that LINK performed better at the start of the trading session today, but the cryptocurrency has been following a downtrend for the last 24 hours. However, if the resistance present at $6.87 persists, then the coin may start to recover in the coming hours. On the other hand, if the selling pressure continues, then LINK may step down into the $6.62 support level.