
The Chainlink (LINK) price prediction for Jan. has turned bullish due to a reclaim of a long-term horizontal support area.
There was some positive Chainlink news last week. CV Labs accelerator announced a partnership with Chainlink Labs. Next, Polarys is using the Chainlink price feed in order to display the prices of digital assets in USD.
Despite only lukewarm news, the Chainlink price increased significantly last week and was saved from a potential breakdown, which could have had massive implications for the future price.
Bullish Divergence in the Weekly RSI
The technical analysis from the weekly time frame shows that the LINK price has fallen since reaching a maximum price of $53 in May 2021. Chainlink reached a low of $5.30 in June 2021 before bouncing, validating the $5.80 horizontal area as support.
Since then, it has traded in a range between $5.30 and $9.
A very interesting development is the bullish divergence in the weekly RSI. This is the first time in history that the weekly RSI has generated such a significant bullish divergence. Therefore, it is possible that the divergence will catalyze a significant upward movement.
However, the LINK price needs to close above $9 in order for the long-term Chainlink price forecast to be bullish.
On the other hand, a weekly close below the $5.80 support area would instead suggest that the trend is still bearish.
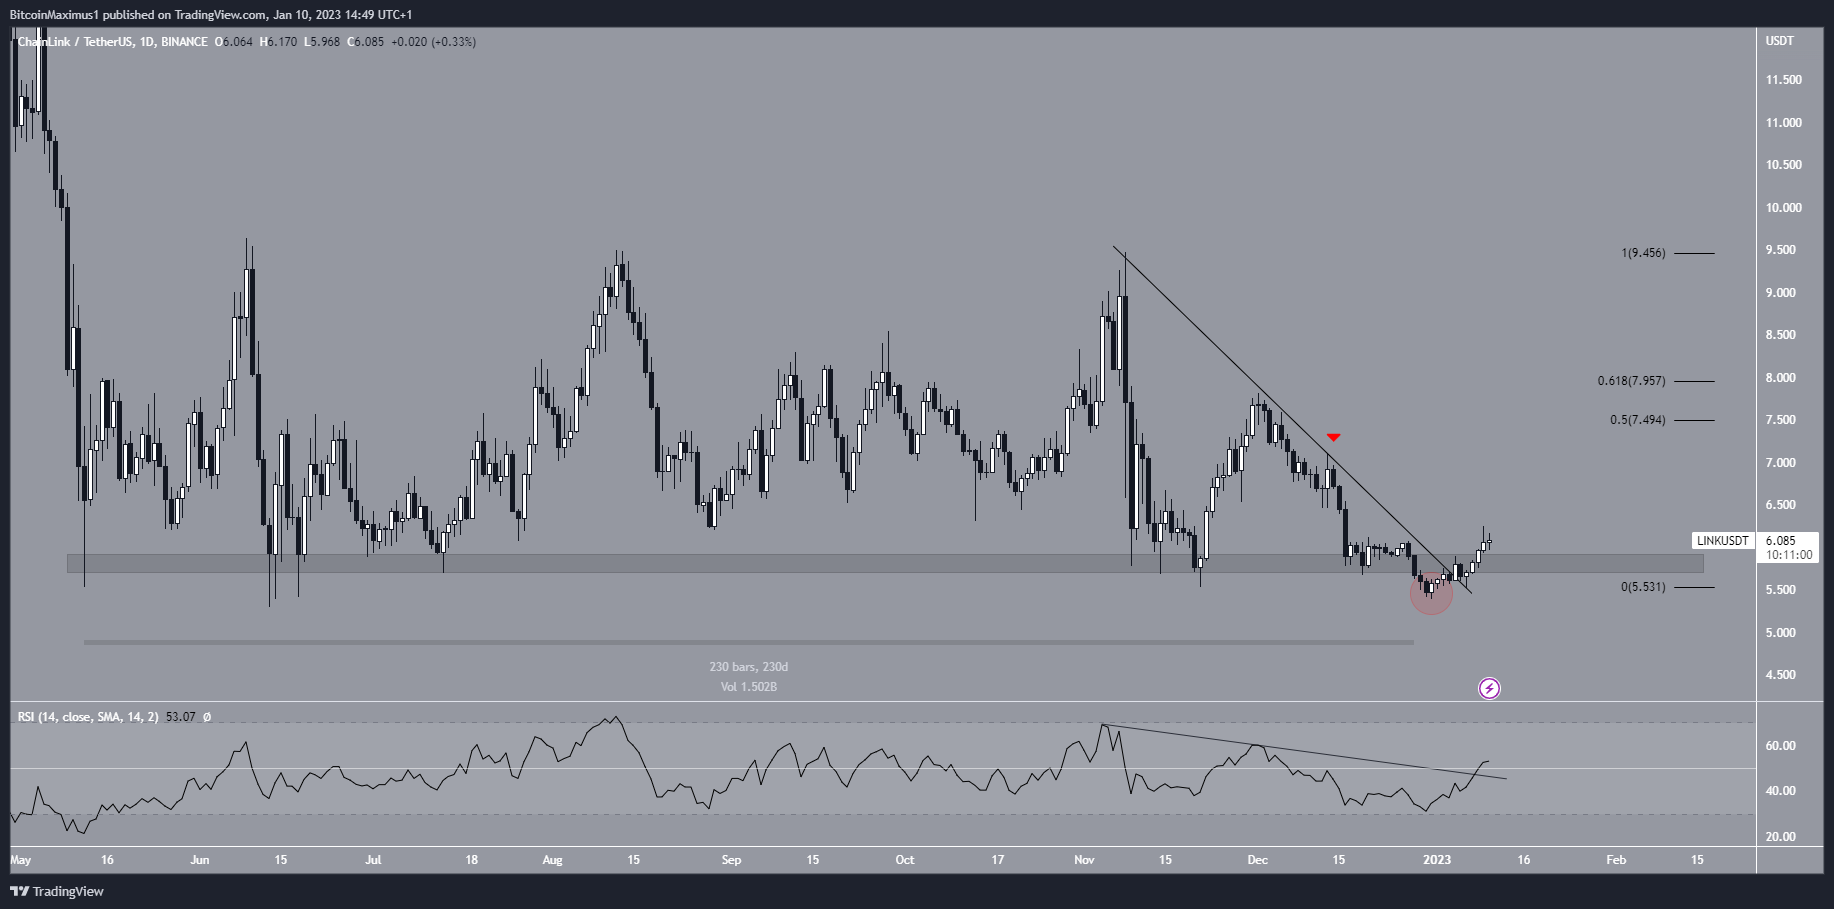
Chainlink Price Prediction For Jan: $7.50 in Sight?
On Dec. 28, the Chainlink price seemingly broke down from a 230-day support area. Due to the area being in place for such a long period of time, this was expected to initiate a significant downward movement. However, the LINK price reclaimed the area shortly afterward. This is considered a strong bullish sign, since the previous breakdown (red circle) was not legitimate.
Furthermore, the Chainlink price broke out from a descending resistance line that had been in place since Nov. 8. On top of this, the daily RSI also broke out from its descending resistance line and has now moved above 50.
All of these are considered bullish signs that support the continuation of the upward movement. If the increase continues, the closest resistance would be between $7.50 and $7.95, the 0.5-0.618 Fib retracement resistance levels.
On the other hand, a drop below the Dec. 31 low of $5.38 would invalidate this bullish hypothesis, though the bullish divergence in the weekly time frame could still be intact.
To conclude, the Chainlink price prediction for January is considered bullish due to the reclaim of the $5.80 area and breakout from a descending resistance line. However, the long-term price forecast can only be considered bullish once the LINK price reaches a weekly close above $9.
For BeInCrypto’s latest crypto market analysis, click here.
Disclaimer
BeInCrypto strives to provide accurate and up-to-date information, but it will not be responsible for any missing facts or inaccurate information. You comply and understand that you should use any of this information at your own risk. Cryptocurrencies are highly volatile financial assets, so research and make your own financial decisions.