

- Solana price is still posting bullish candles despite the slowdown in the broader market, trading at $23.92.
- SOL has the support of its 30-, 50- and 100-day Exponential Moving Averages, which should prevent a sharp decline in price.
- The altcoin’s indicators are pointing towards intensifying bearishness, with the MACD registering a bearish crossover this week.
Solana price is maintaining its presence above the $22 mark that it reclaimed about a week ago, enabling the altcoin to preserve its uptrend. The next major hurdle for the altcoin stands at $28.28, which will determine whether the uptrend can continue or if SOL will lose the opportunity to regain November 2022 crash’s losses.
Solana price remains in an incline
Solana price, trading at $23.91, is defying the downward trend seen in many cryptocurrencies by maintaining its upward momentum despite the noticeable slowdown. SOL could reaffirm its macro uptrend that began at the beginning of the month by reclaiming $28.28.
Acting as the critical resistance, this price level is crucial for the Ethereum killer to reclaim in order to recoup the losses SOL noted following the FTX collapse-induced crash. Flipping $28.28 into a support floor will push the price toward the next hurdle at $32.06, breaching which will enable Solana price to tag November 2022 highs of $36.90.
Even though the altcoin does have the support of the 30-, 50- and 100-day Exponential Moving Averages (EMA), there is a chance of a possible decline in price. The Moving Average Convergence Divergence (MACD) indicator highlights an active bearish crossover that took place a week ago.
Solana Moving Average Convergence Divergence (MACD)
If the bearishness intensifies and traders move to sell, the price could decline quickly. As it is, Solana price is treading right above the immediate support level at $22.77. A single red candle could invalidate this support floor, which could leave the price vulnerable to a decline to $19.30.
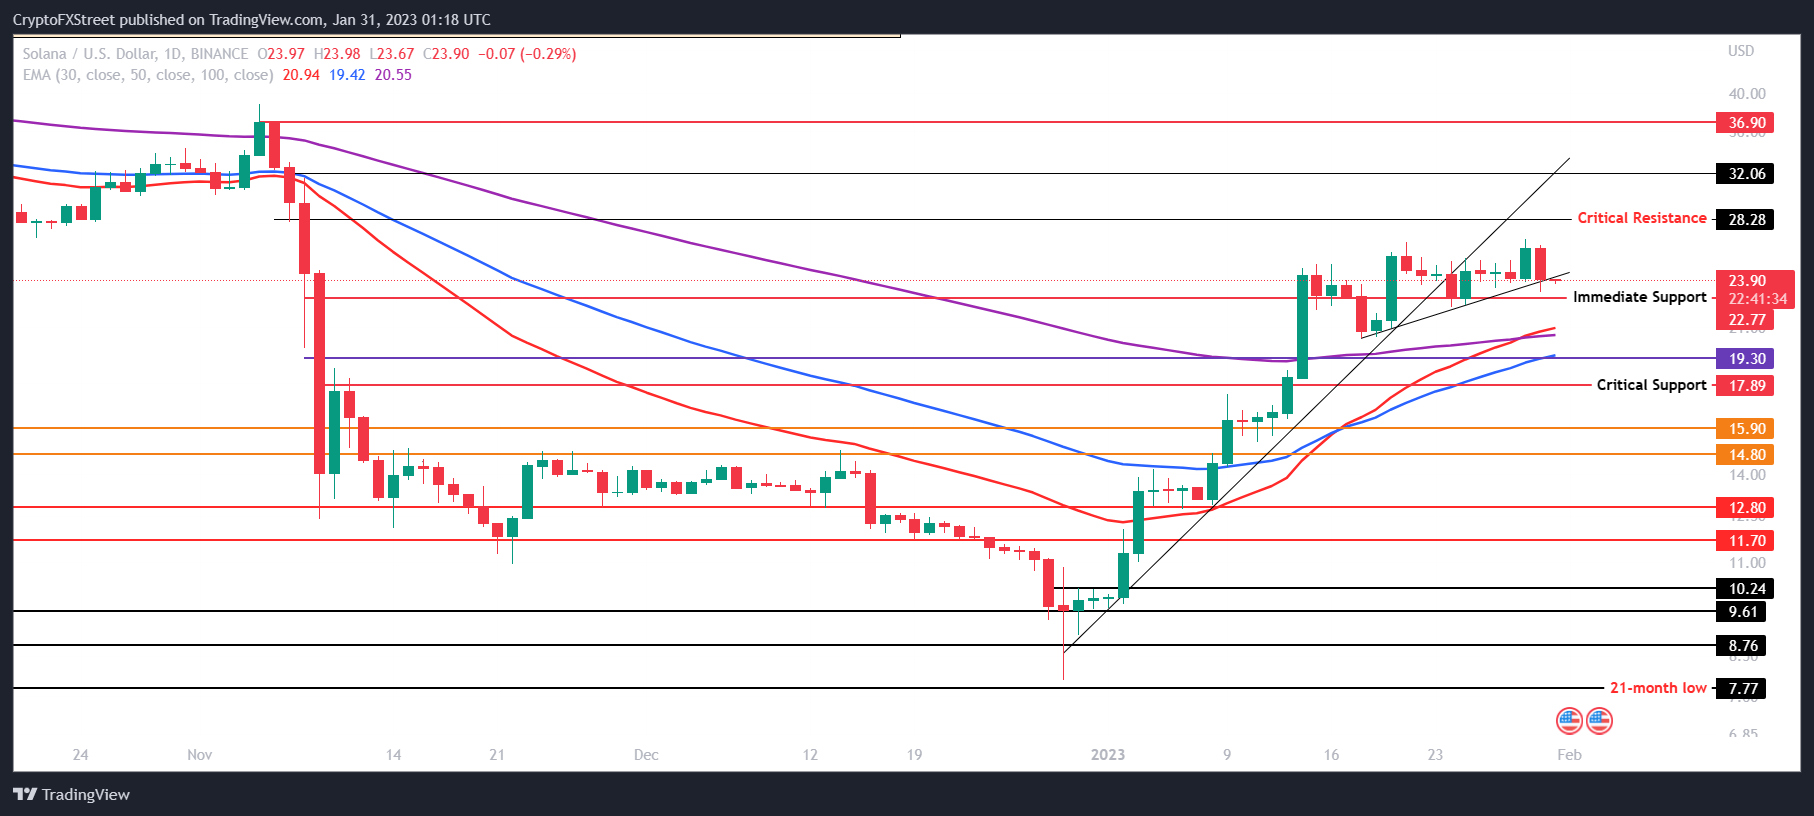
SOL/USD 1-day chart
Falling through it will give SOL another opportunity to bounce off the critical support at $17.89. However, a daily candlestick close below $17.89 will invalidate the bullish thesis, bringing the price action bearish towards $15.90.